Join the Gradeo waitlist today.

Past papers cannot predict the next HSC Agriculture exam, but they can show how the subject has been assessed over time.
We mapped HSC Agriculture exam items from 2015 to 2025 by answer type, directive verb, module, marks and syllabus outcome. The purpose is not to guess future papers. It is to identify patterns that may help students and teachers check whether preparation is balanced.
This is a best-endeavours analysis of past papers and marking materials. Exam committees change, question design changes, and past emphasis does not guarantee future emphasis. Students should still prepare across the full syllabus and rely on official NESA materials, their teachers and their school's advice.
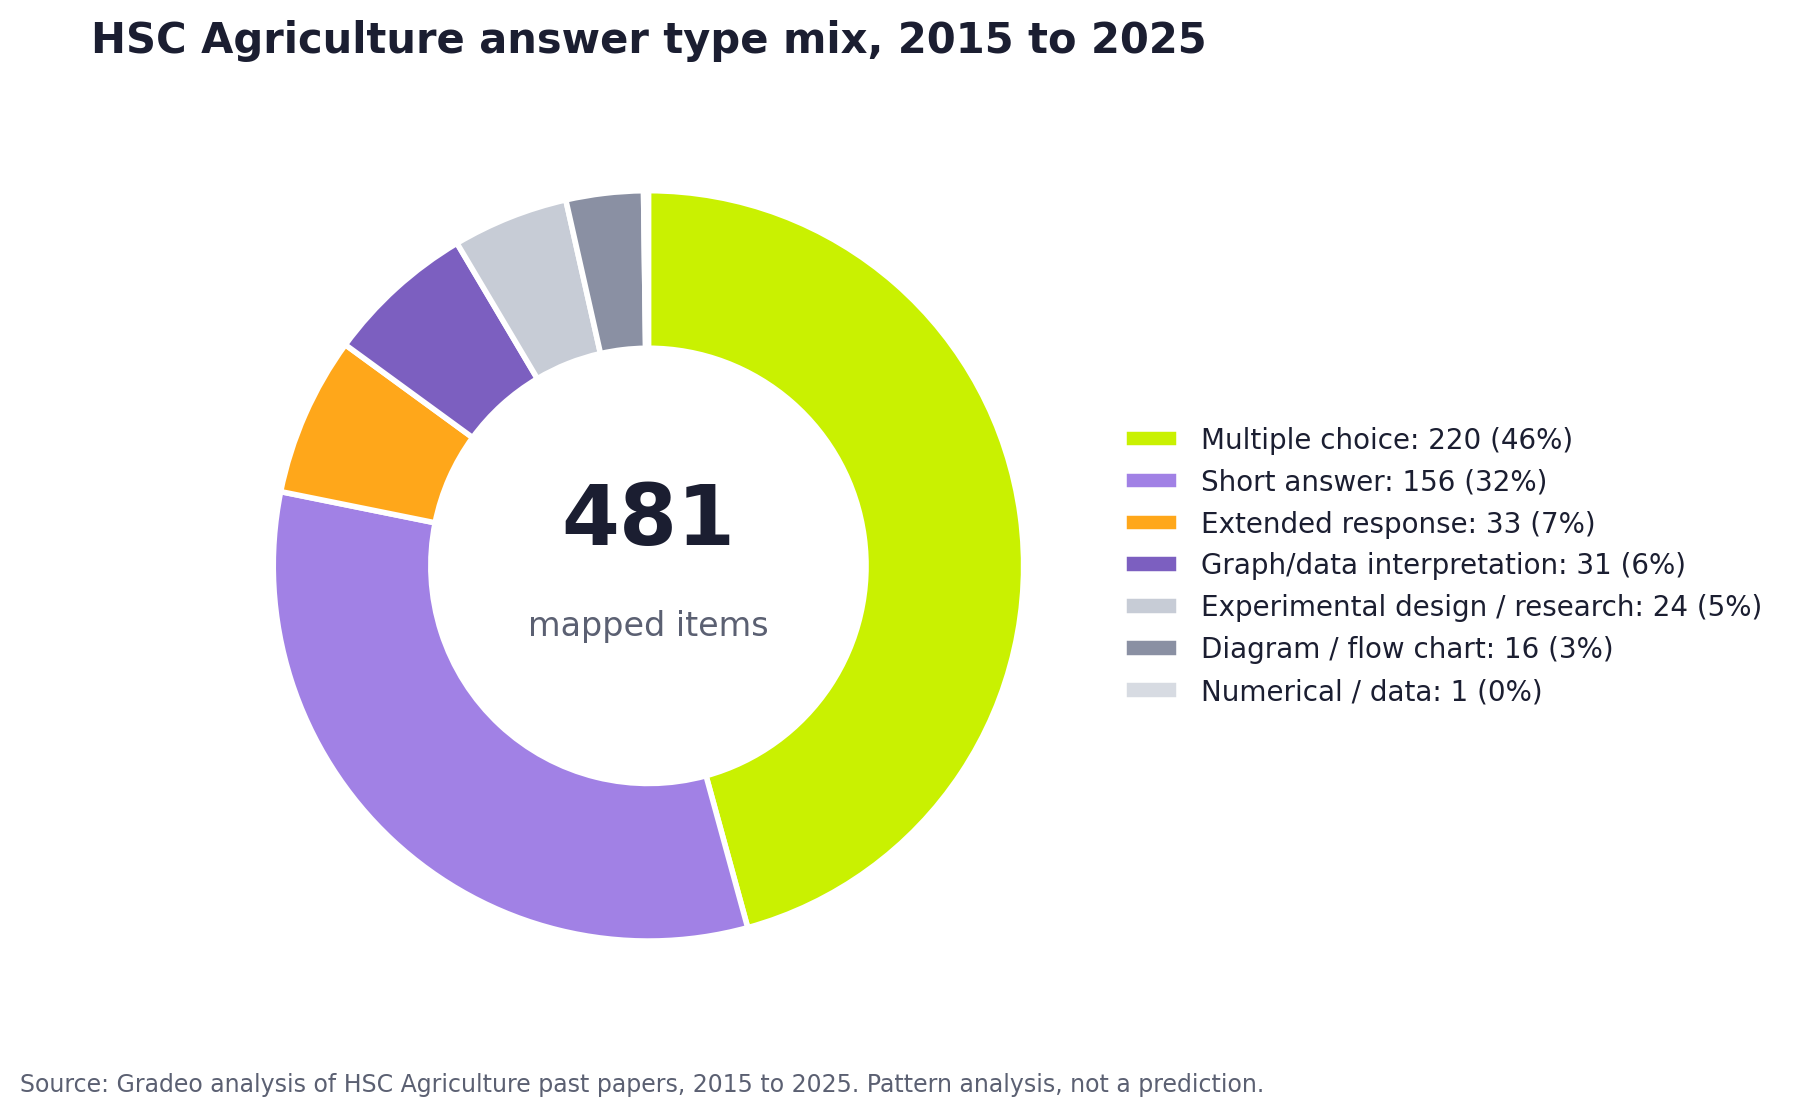
Across 2015 to 2025, the analysis mapped 481 Agriculture items. The answer type breakdown was:
Multiple choice appears every year, with 20 items in each paper. That is part of the exam structure, so it should not be treated as the main insight.
The more useful point is the mix of written and practical response types. Agriculture is not only asking students to recall facts about production systems. It also asks them to interpret data, respond to graphs, design or discuss investigations, use diagrams and apply scientific reasoning to agricultural contexts. That is where students can be caught out if their revision is too content-heavy.
Plant/Animal Production is the clearest coverage pattern in the data. Across the mapped period, it accounted for 305 mapped items and 717 mapped marks. That is far higher than any other module.
This is a meaningful finding, but it still needs to be used carefully. It does not mean students can predict future papers or ignore other modules. It does mean weak preparation in Plant/Animal Production is hard to hide.
Students should be confident with production systems, management strategies, biological processes, constraints, technologies, sustainability and the links between inputs, practices and productivity. The key is application. Students need to be able to explain how a production decision affects an agricultural outcome, not just name the practice.
Farm Product Study was the second-largest mapped module, with 103 mapped items and 363 mapped marks. This is a substantial share of the exam.
Students should be ready to apply their farm product knowledge to questions about production, processing, marketing, quality, management, economics and sustainability. A common risk is treating the farm product as a memorised case study rather than using it to answer the question. Stronger responses select relevant detail and link it to the issue being asked.
For teachers, this is a useful area to test whether students can transfer knowledge from a studied product into unfamiliar question wording.
Framing for the 21st Century had 46 mapped items and 296 mapped marks. That is a much higher mark total than the item count alone might suggest.
This is a useful warning. If students only look at how often something appears, they may underestimate areas that appear in larger, higher-value questions. Students should be prepared to discuss broader agricultural issues, including change, innovation, environmental pressures, economic pressures, sustainability and the future of agricultural production. This is also where students may need to show judgement rather than simple recall.
Climate Challenge had 25 mapped items and 156 mapped marks. That is lower than Plant/Animal Production, Farm Product Study and Framing for the 21st Century, but still large enough to matter.
Students should avoid treating it as a minor add-on. Climate-related questions can require students to link environmental conditions, production risks, management responses, sustainability and productivity. This is the kind of topic where stronger responses usually explain the relationship between the challenge and the agricultural response. A general answer about climate is not enough.
Agri-food, Fibre and Fuel Technologies appeared only twice in the mapped period, for 8 mapped marks. This is a low-frequency finding, but it should not be overused.
A low count in past papers does not mean the area is safe to ignore. It may reflect timing, syllabus emphasis, examination design or the way items were classified. Students should still cover the syllabus and follow teacher advice. The practical takeaway is to prepare this area efficiently, but not at the expense of the higher-weight areas that have repeatedly carried larger mark totals.
The strongest directive verb pattern is the dominance of Identify and Outline. Across 2015 to 2025, Identify and Outline appeared 157 times. That is more than all other mapped directive groups combined.
Other directive groups included:
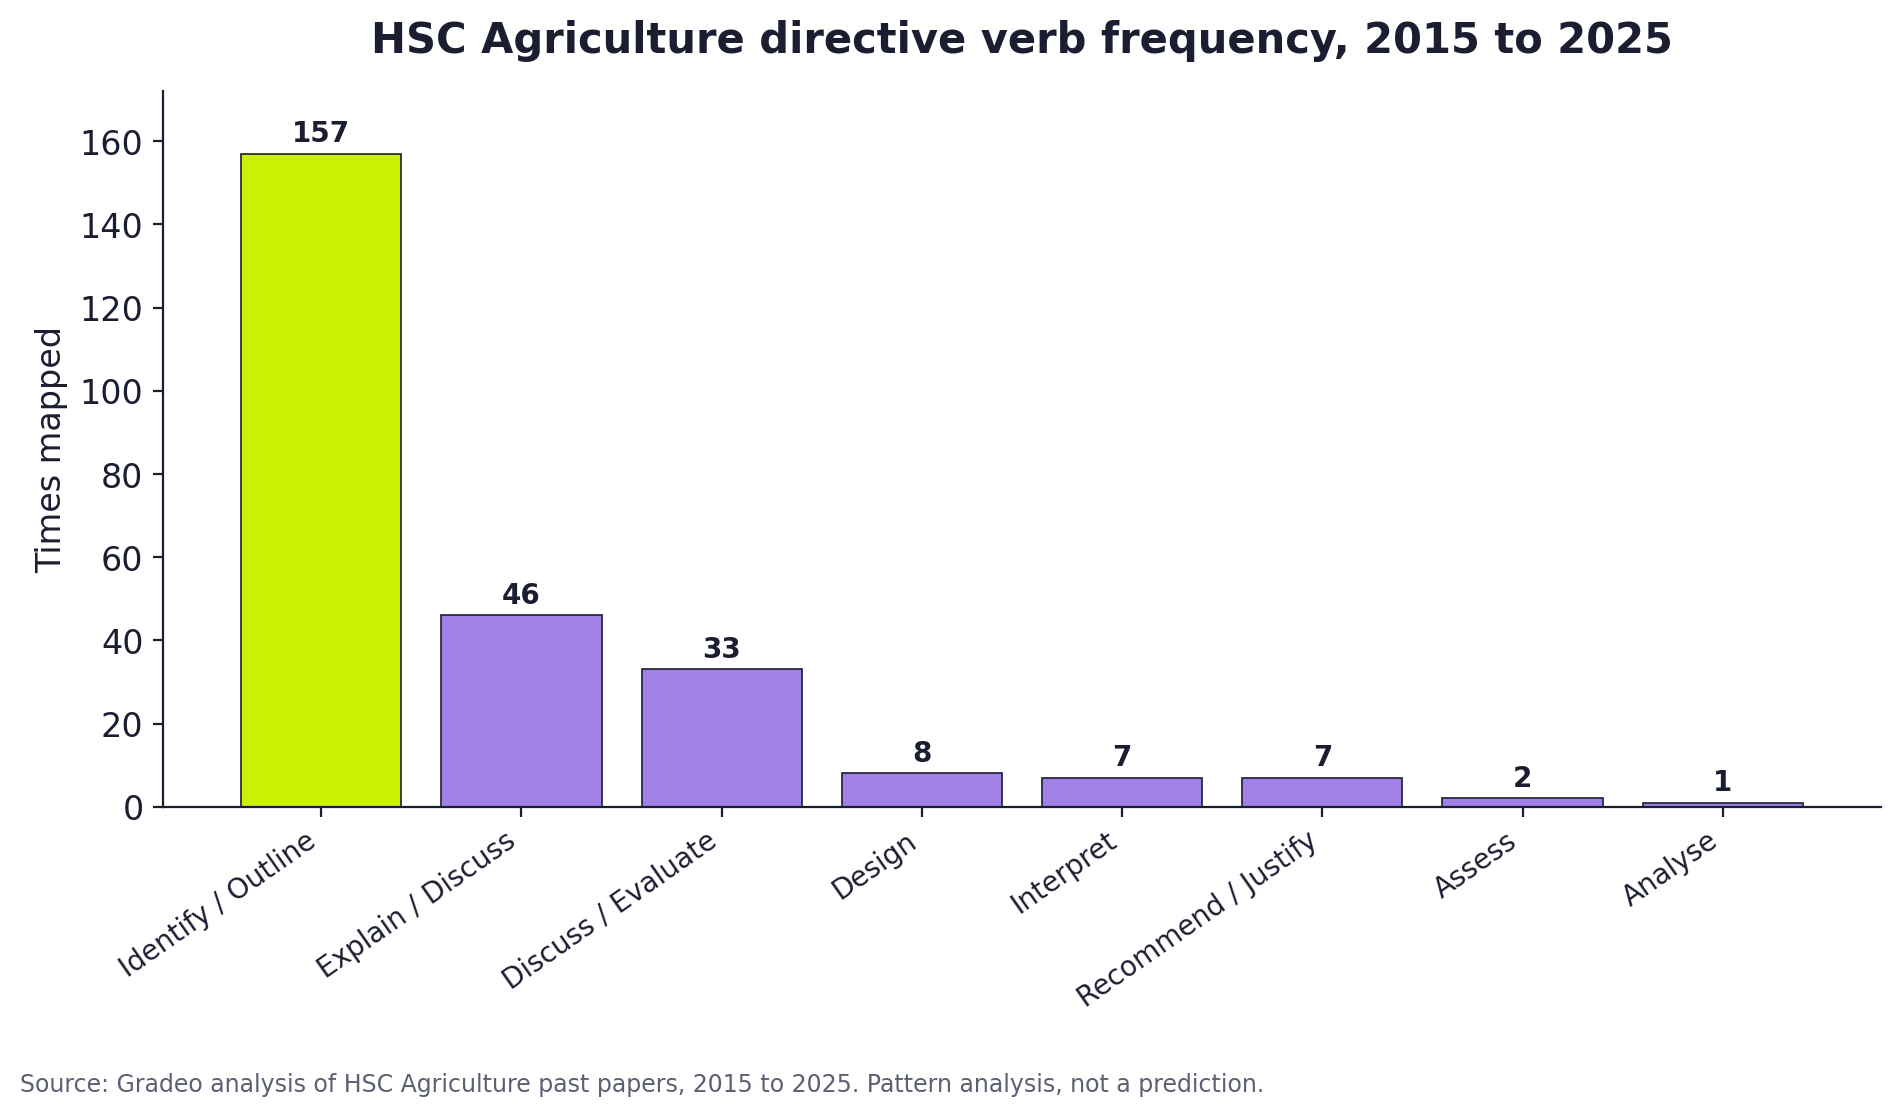
This tells students something important about the paper. Agriculture often rewards accurate recognition, clear naming, and concise explanation of agricultural concepts, processes and relationships. Students need to be able to identify the relevant feature quickly and outline it clearly.
However, that does not mean higher-order responses are unimportant. Discuss, Evaluate, Design, Interpret and Recommend or Justify appear less frequently, but they can carry more demanding marks and require deeper application.
Experimental design and research responses appeared 24 times, while graph and data interpretation appeared 31 times. Together, these are a major practical skills signal. Students should be able to:
These tasks suit Agriculture because the subject sits between science, production and real-world decision-making. Students who only revise notes may struggle when asked to interpret unfamiliar data or design an investigation. For teachers, this is a useful area for regular low-stakes practice.
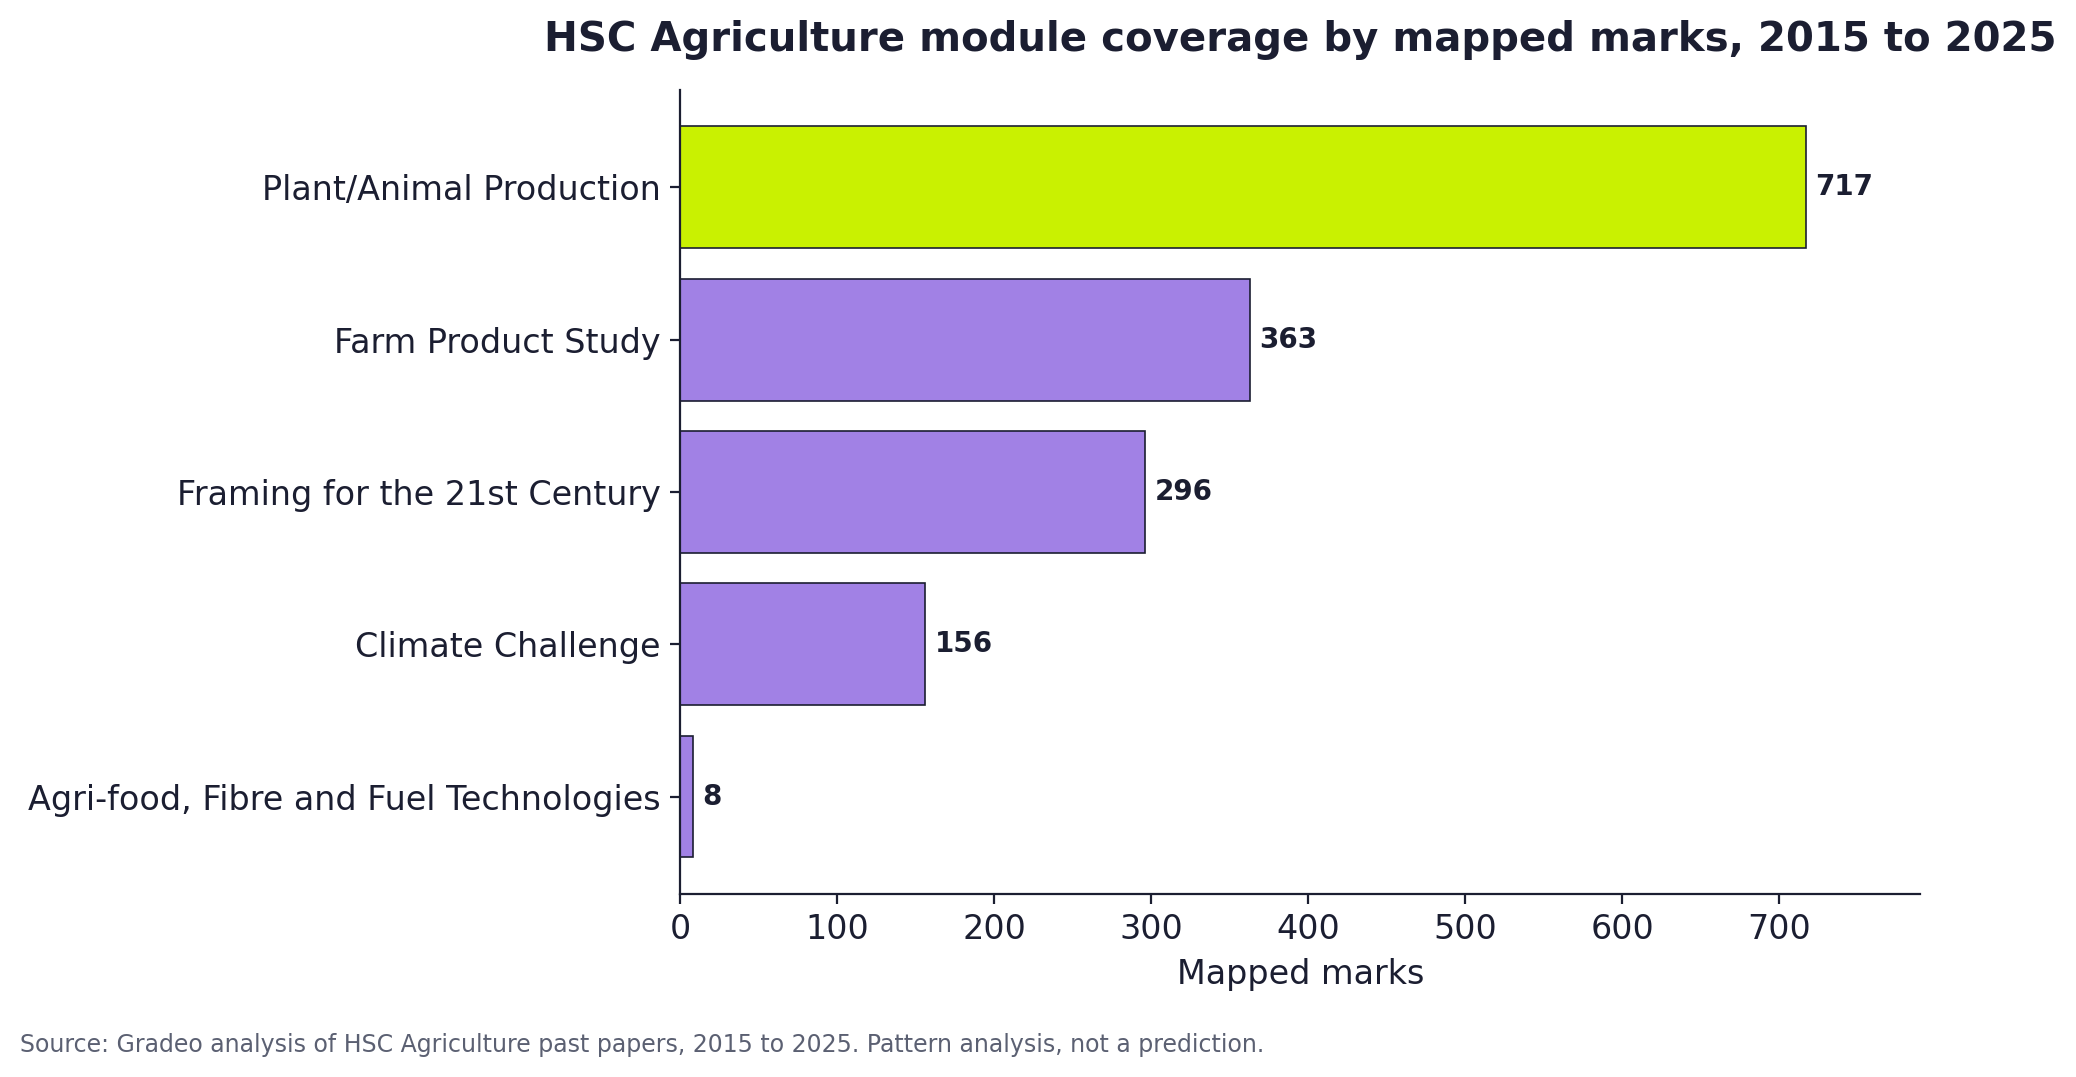
Diagram and flow chart responses appeared 16 times across the mapped period. That is not a dominant category, but it is frequent enough to matter.
Students should be comfortable using diagrams and flow charts to show processes, relationships, production systems or sequences. These response types can reward clarity. They can also expose vague understanding. A useful revision task is to take a production process or management response and represent it visually, then explain the links in words. If a student cannot draw or sequence the process clearly, they may not understand it well enough for an exam response.
The outcome mapping shows H1.1 as the most frequently assessed outcome overall. The analysis also shows H3 inquiry and research skill outcomes appearing across the paper. That fits the broader pattern of the subject.
Agriculture students need content knowledge, but they also need to apply it through investigation, data interpretation, management decisions and practical agricultural contexts. A strong answer often does three things: it identifies the relevant agricultural issue or process, explains how it affects production, sustainability or management, and supports the answer with evidence, data or a practical example. This is why Agriculture preparation should include both content revision and applied response practice.
Students should use this analysis as a revision audit. Useful questions to ask:
The wrong use of this analysis is to try to predict the next paper. The right use is to identify gaps in preparation.
For teachers, the analysis may be useful as a planning check. It can help identify whether revision is too focused on content recall, whether Plant/Animal Production is being practised at sufficient depth, whether students can apply their Farm Product Study, and whether practical response types are being rehearsed.
It may also support targeted practice. For example:
This analysis has limits.
It is a pattern analysis, not a prediction model.
The Agriculture papers from 2015 to 2025 suggest a strong emphasis on Plant/Animal Production, supported by Farm Product Study and broader agricultural issues.
The most useful insight is not to chase the most common module. It is to recognise the type of preparation Agriculture rewards: accurate identification, clear outlining, practical application, data interpretation, investigation design and the ability to connect agricultural knowledge to production and management decisions.
Students should prepare across the whole syllabus, but they should make sure their study is not just note-based. Agriculture rewards students who can use knowledge in practical, scientific and agricultural contexts.
No. Past papers can show previous patterns, but they cannot predict future papers.
This analysis covers HSC Agriculture papers from 2015 to 2025.
Plant/Animal Production had the highest mapped coverage, with 305 items and 717 marks across the period analysed.
No. Plant/Animal Production was dominant in the mapping, but students should still prepare across the full syllabus.
Identify and Outline appeared most often, with 157 mapped appearances across 2015 to 2025.
Yes. Graph and data interpretation appeared 31 times, and experimental design and research responses appeared 24 times. These are important practical skills.
They are not dominant, but they appeared 16 times in the mapped period. Students should be comfortable using diagrams or flow charts to represent agricultural processes where required.
Do not use past papers to predict. Use them to check whether you can apply agricultural knowledge through short answers, data interpretation, investigation design and extended responses.
.png)


Book a demo to see how Gradeo can help create, deliver, mark and analyse assessments in one secure platform.
