Join the Gradeo waitlist today.

Past papers cannot predict the next HSC Economics exam, but they can show how the current syllabus has been assessed over time.
We mapped HSC Economics exam items from 2018 to 2025 by answer type, directive verb, topic, marks and syllabus outcome. The point is not to guess the next paper. It is to identify patterns that may help students and teachers check whether preparation is balanced.
This is a best-endeavours analysis of past papers and marking materials. Exam committees change, question design changes, economic conditions change, and past emphasis does not guarantee future emphasis. Students should still prepare across the full syllabus and rely on official NESA materials, their teachers and their school's advice.
The most useful directive verb finding is the dominance of Explain. Across the mapped written questions from 2018 to 2025, Explain appeared 47 times. The next most common directive verbs were Outline with 23 appearances and Assess with 12. Together, Explain, Outline and Assess accounted for 82 of the 134 mapped written-question directives.
That tells students something practical. Economics is not just asking for definitions. It regularly asks students to explain relationships between causes, effects, policies, markets, indicators and outcomes.
A strong Economics answer usually needs a clear chain of reasoning:
Students who memorise content but cannot explain the link between concepts are exposed in this subject.
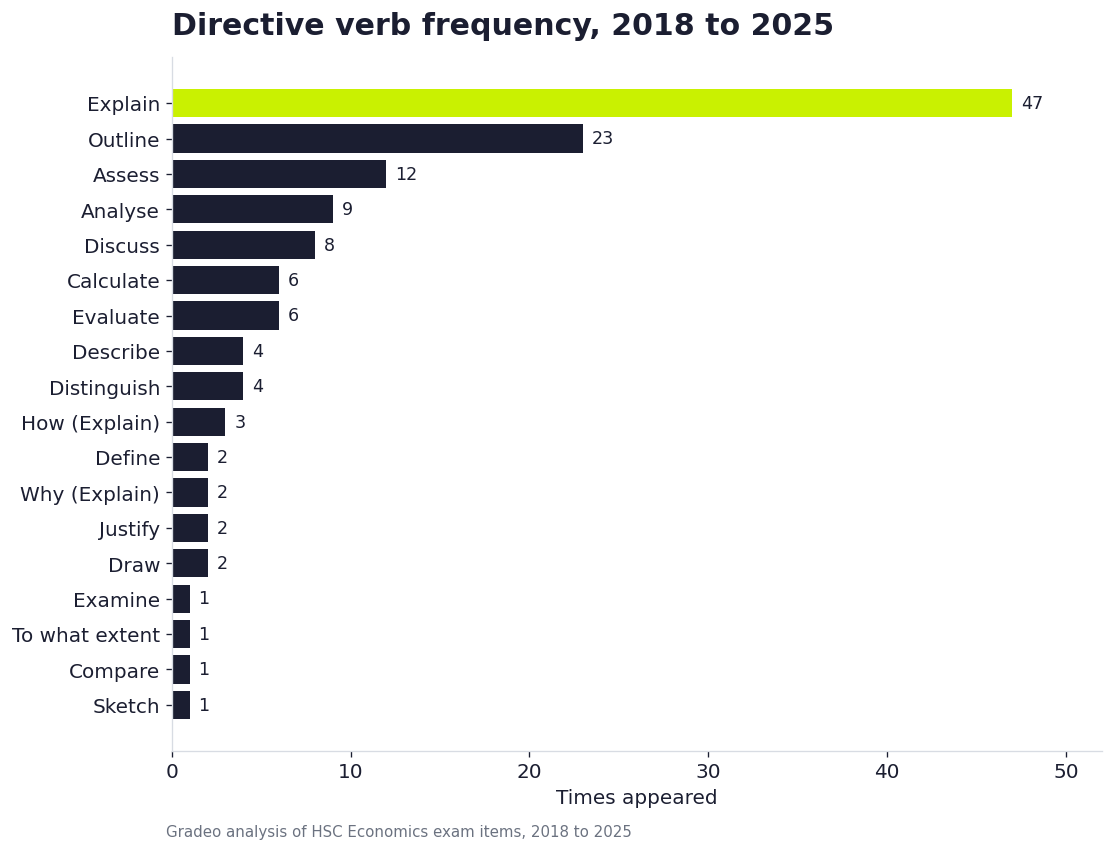
Assess appeared 12 times across the mapped period, making it one of the most common higher-order directive verbs. That matters because Economics students are often asked to make a judgement about effectiveness, significance, impact or the extent of change. A weaker response might list points for and against. A stronger response usually weighs them.
For example, when assessing a policy, students should be able to consider:
This is one of the areas where current examples matter. Students need to connect theory to real economic conditions, not just describe the theory in isolation.
Across the 2018 to 2025 mapping, Economic Issues was the largest topic area by both question count and marks. The mapped topic coverage was:
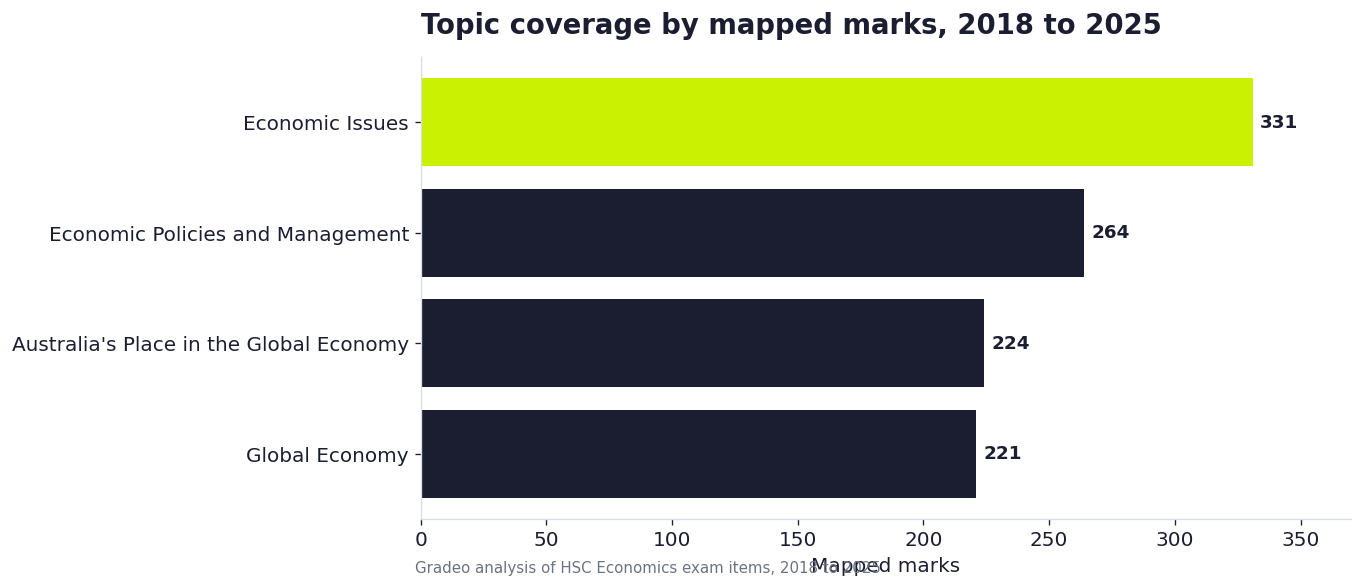
This should not be used to narrow study. It does not mean Economic Issues will dominate the next paper. But it does make sense pedagogically. Economic Issues includes major recurring areas such as economic growth, unemployment, inflation, external stability, distribution of income and wealth, and environmental sustainability. These are areas where students can be asked to explain causes, analyse effects and assess policy responses.
Students should treat Economic Issues as a core area for applied writing, not just a list of indicators to memorise.
Economic Policies and Management was the second-largest mapped topic by marks, with 264 mapped marks. That matters because policy questions often reward students who can connect the policy tool to the economic issue it is meant to address. The common weakness is describing a policy without explaining the transmission mechanism.
For example, a student might know what monetary policy is, but still need to explain how a change in interest rates may affect consumption, investment, aggregate demand, inflation, employment, exchange rates or external stability.
Good policy responses usually connect:
Students should practise policy responses as cause-and-effect arguments, not as memorised descriptions.
Australia's Place in the Global Economy had the lowest mapped item count, with 60 items, while Global Economy had 66. By mapped marks, the two were very close: Australia's Place had 224 marks and Global Economy had 221.
The useful point is not that either topic can be skipped. They cannot. These topics often provide the context for the rest of the course. Globalisation, trade, financial flows, exchange rates, external stability and Australia's economic relationships can all shape questions about growth, inflation, labour markets, external accounts and policy choices.
Students should avoid treating the course as four isolated topics. Economics often rewards students who can connect the global and domestic sides of the syllabus.
The answer type mapping identified 294 items from 2018 to 2025:
Multiple choice accounts for the largest number of items, but that is partly a function of the paper structure. It should not be treated as the main insight. The more important point is that the written sections carry the real economic reasoning. Short answer and extended response questions are where students need to explain relationships, use evidence, assess significance and write clearly under time pressure.
Extended response items appeared consistently, with four mapped items in each year. That reinforces the need for regular essay practice. Students should not leave extended responses until the final weeks. They need repeated practice building arguments, using examples and making judgements.
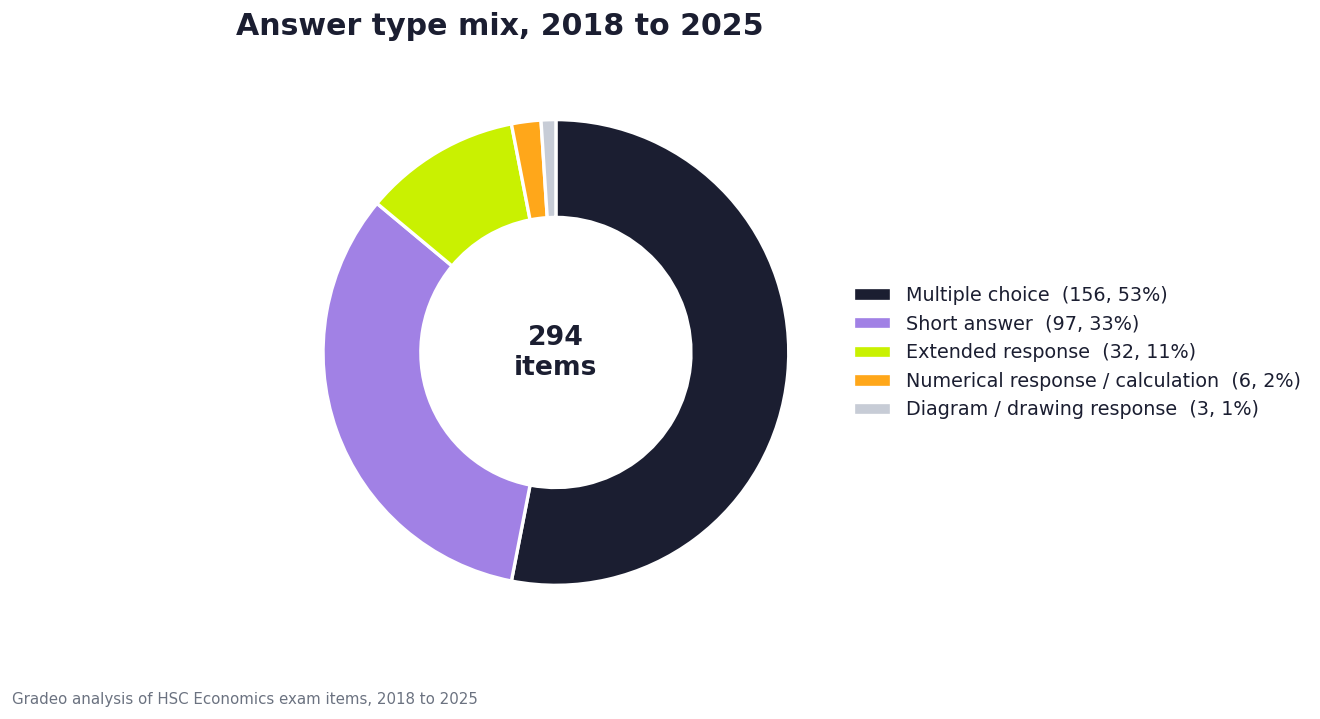
Numerical response / calculation items appeared six times in the mapped period, all in 2024 and 2025. Diagram / drawing responses appeared three times, in 2020, 2021 and 2023. These are small numbers, so they should not be overstated.
However, Economics students should still be comfortable with data, diagrams and numerical information. Even when a question does not require a formal calculation, students may need to interpret statistics, trends, graphs, exchange rate movements, inflation data, unemployment data, balance of payments information or other economic indicators. The skill is not just calculation. It is being able to use economic data to support an explanation or judgement.
Students should practise:
The outcome mapping showed H1 appearing frequently across both multiple choice and written sections. H6 and H7 were also strongly represented, especially in written responses. That pattern is consistent with the nature of Economics. Students need knowledge of economic concepts and relationships, but they also need to analyse issues, use economic information and communicate arguments.
The practical lesson is that Economics preparation should combine:
Students who only memorise theory are likely to struggle in written sections. Students who only learn current examples without understanding the underlying economics are also exposed.
The safest use of this analysis is as a revision audit. Students should ask:
The wrong use of this analysis is to try to predict the next paper. The right use is to find gaps in preparation.
For teachers, the analysis is useful as a planning check. It can help identify whether students are over-relying on definitions, whether extended response practice is happening often enough, whether Economic Issues and policy connections are being rehearsed properly, and whether students are using current examples effectively.
It may also support targeted practice. For example:
This analysis has limits.
It is a pattern analysis, not a prediction model.
The HSC Economics papers from 2018 to 2025 suggest that students should focus on explanation, judgement and applied economic reasoning. Economic Issues carried the most mapped marks, but all four topics remain important. Policy knowledge needs to be linked to the problems policies are designed to address. Global and domestic economics should be connected, not studied in isolation.
The strongest preparation is not topic guessing. It is being able to explain mechanisms, use current examples, interpret data, and make clear judgements under exam conditions. Past paper analytics can help students and teachers check whether preparation is balanced. They should not be used as a shortcut or forecast.
No. Past papers can show previous patterns, but they cannot predict future papers.
This analysis covers HSC Economics papers from 2018 to 2025, the current syllabus period.
Economic Issues had the most mapped items and marks, with 97 items and 331 marks across the period analysed.
No. Economic Issues was prominent in the mapping, but all four topics need to be prepared.
Explain was the most common written-question directive verb, appearing 47 times in the mapped period.
Formal numerical response / calculation items were not common in the mapped period, with six items. However, students should still be confident interpreting data, graphs and economic indicators.
Current examples help students apply theory to real economic conditions. They are especially useful for policy, Economic Issues and extended responses.
Practise explaining economic mechanisms, assessing policy effectiveness, using current examples and connecting topics across the syllabus.
.png)


Book a demo to see how Gradeo can help create, deliver, mark and analyse assessments in one secure platform.
